
Patient satisfaction
Among surveyed encounters
 Back to the community program
CHESTERFIELD COUNTY, SOUTH CAROLINA
What happens when a community makes a connection to care part of everyday life?
Chesterfield County brought Tap to its residents. In its first 18 months, the program recorded more than 15,000 patient encounters—and a story that reaches well beyond the doctor’s visit.
Company-reported case study · April 2026 · About the evidence
 CHESTERFIELD COUNTYSouth Carolina
patient encounters
in the first 18 months
Among surveyed encounters
Patients who used Tap more than once
First message to physician reply
Reported results from Tap’s first-18-month summary. Survey sample size and repeat-use denominator are not supplied. View source, page 5
01 / THE PLACE & ITS PEOPLE
For a rural county, access is shaped by distance, transportation, work and the availability of a doctor.
Chesterfield’s leaders brought a new connection into the places residents already trusted: schools, EMS, local government and employers.
See what the county put in placeCounty figures as presented in the April 2026 case study; underlying reference years are not listed. Source, page 3
02 / THE COMMUNITY VALUE
Behind every number is something a community cares about.
Choose a benefit. See what it means for people.
 Emergency readiness
For the person who needs emergency care most.
estimated EMS costs avoided
An appropriate first call for a non-emergency can help keep an ambulance available for a heart attack, a stroke, or a serious accident.
The source applies state average EMS run costs to reported deployments avoided. Average run cost includes costs that may remain even when a deployment is avoided, so this estimate does not establish a cash reduction in an EMS budget.
View the report · page 9Company-reported activity and estimates. The monetary total combines ED costs, EMS costs and wages; school days are separate. Actual budget savings depend on costs that can be avoided.
Explore your community’s possibilitiesSavings matter.Being there for the person who needs emergency care most is priceless.
03 / WHO REACHED FOR CARE
The reported age distribution spans children, working-age adults and older residents. A familiar way to reach care can serve many different moments in community life.
One way in.
Many reasons to reach out.
Shares reproduced from the company case study. The source does not specify the underlying sample size. Source, page 6
04 / WHAT THE COUNTY BUILT
Three parts of the Chesterfield model work together.
A care team reached by text, audio or video, with no insurance requirement or copay in the county’s reported program.
Prescriptions routed to local pharmacies. People who need in-person assessment referred into the local health system with clinical context.
County and municipal leaders, schools, EMS and employers help residents discover and use the service.
Tap operates the care program. Local leaders establish the partnership, connect the community and review its results. Terms and funding are agreed for each community.
READ THE EVIDENCE
This page adapts Tap’s April 2026 case study for community leaders. It preserves the distinction between reported activity and estimated economic value.
Original Chesterfield case study18-page English PDF · April 2026 · 1.7 MBThese results are company-reported by Tap / MD Health Pathways. The source provides summaries and high-level methods. It does not provide an independent audit, underlying encounter-level data, comparison groups or uncertainty estimates.
Use the case study as a starting point for reviewing local assumptions, measurement and program fit.
The headline outcomes are described as the first 18 months of operation. The separate monthly utilization chart is labeled September 2024–January 2026, a 17-month span. The report does not reconcile those periods or supply a complete monthly data table.
This page retains the stated headline period and does not reconstruct exact monthly encounter counts from the chart.
The report compares $8.7M+ in estimated community value with a $1.67M launch grant: approximately 5.2 dollars of estimated value per grant dollar. The monetary total combines $3.6M in ED costs avoided, approximately $700K in EMS costs avoided and $4.4M in wage recovery.
That ratio combines benefits across residents and services. It does not establish an investment return, operating profit or cash savings for a municipality or hospital.
Confirm the local access gap, clinical coverage, staffing and billing responsibilities, eligibility, funding, and the costs that can actually be avoided. Agree on baseline measures and how outcomes will be reported.
The original presentation includes time-sensitive Texas funding opportunities and May 2026 deadlines. Those historical details are not presented here as current funding advice. Its named launch-funding references also require clarification before being applied to another community.
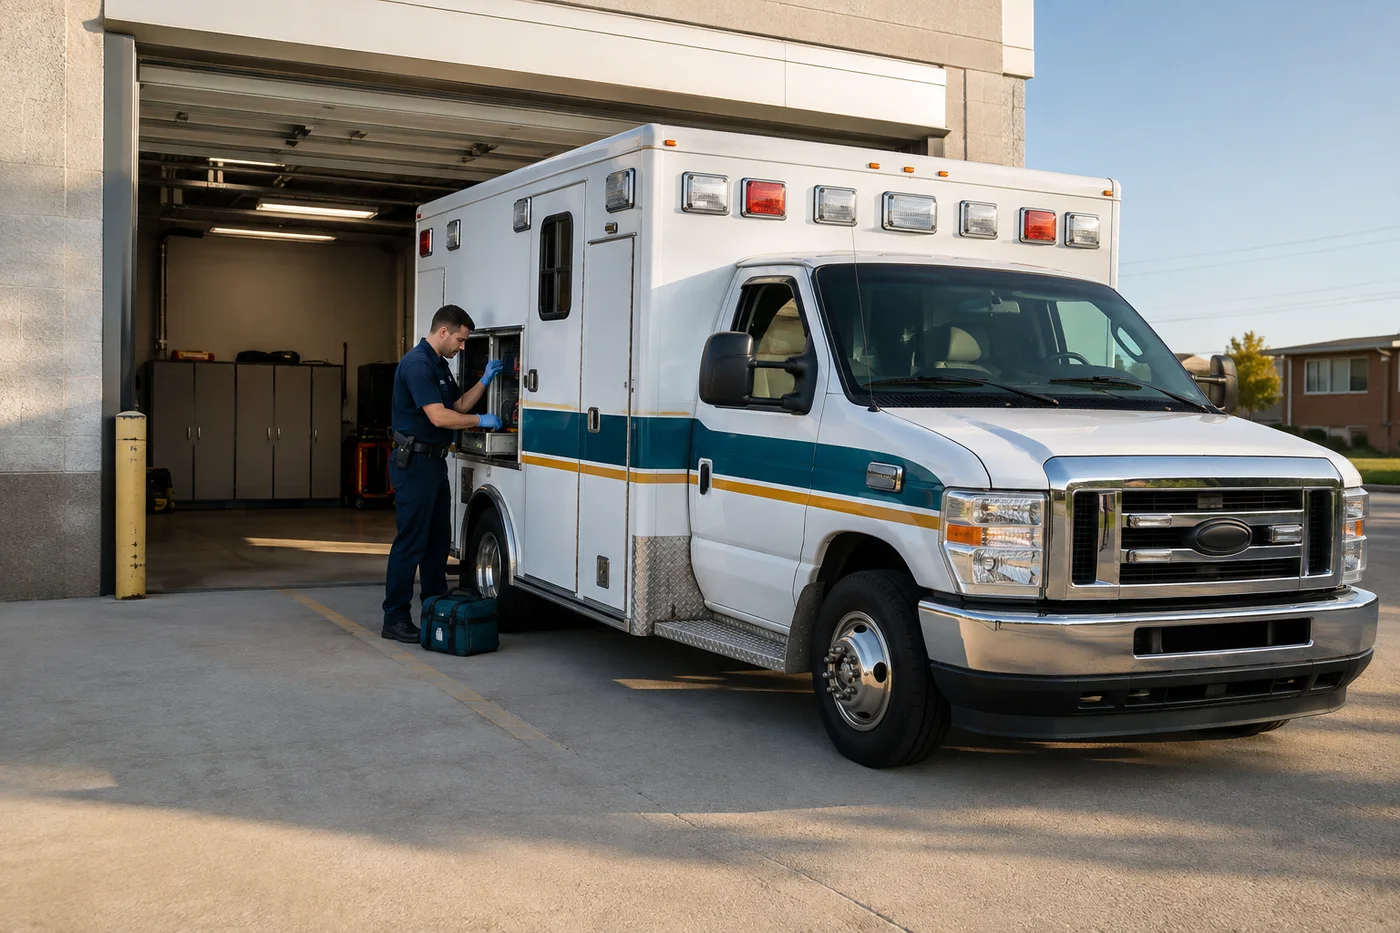
Community benefit illustrations. The ambulance, school arrival and clinical consultation scenes are illustrative images, not photographs of Chesterfield patients, providers or facilities.
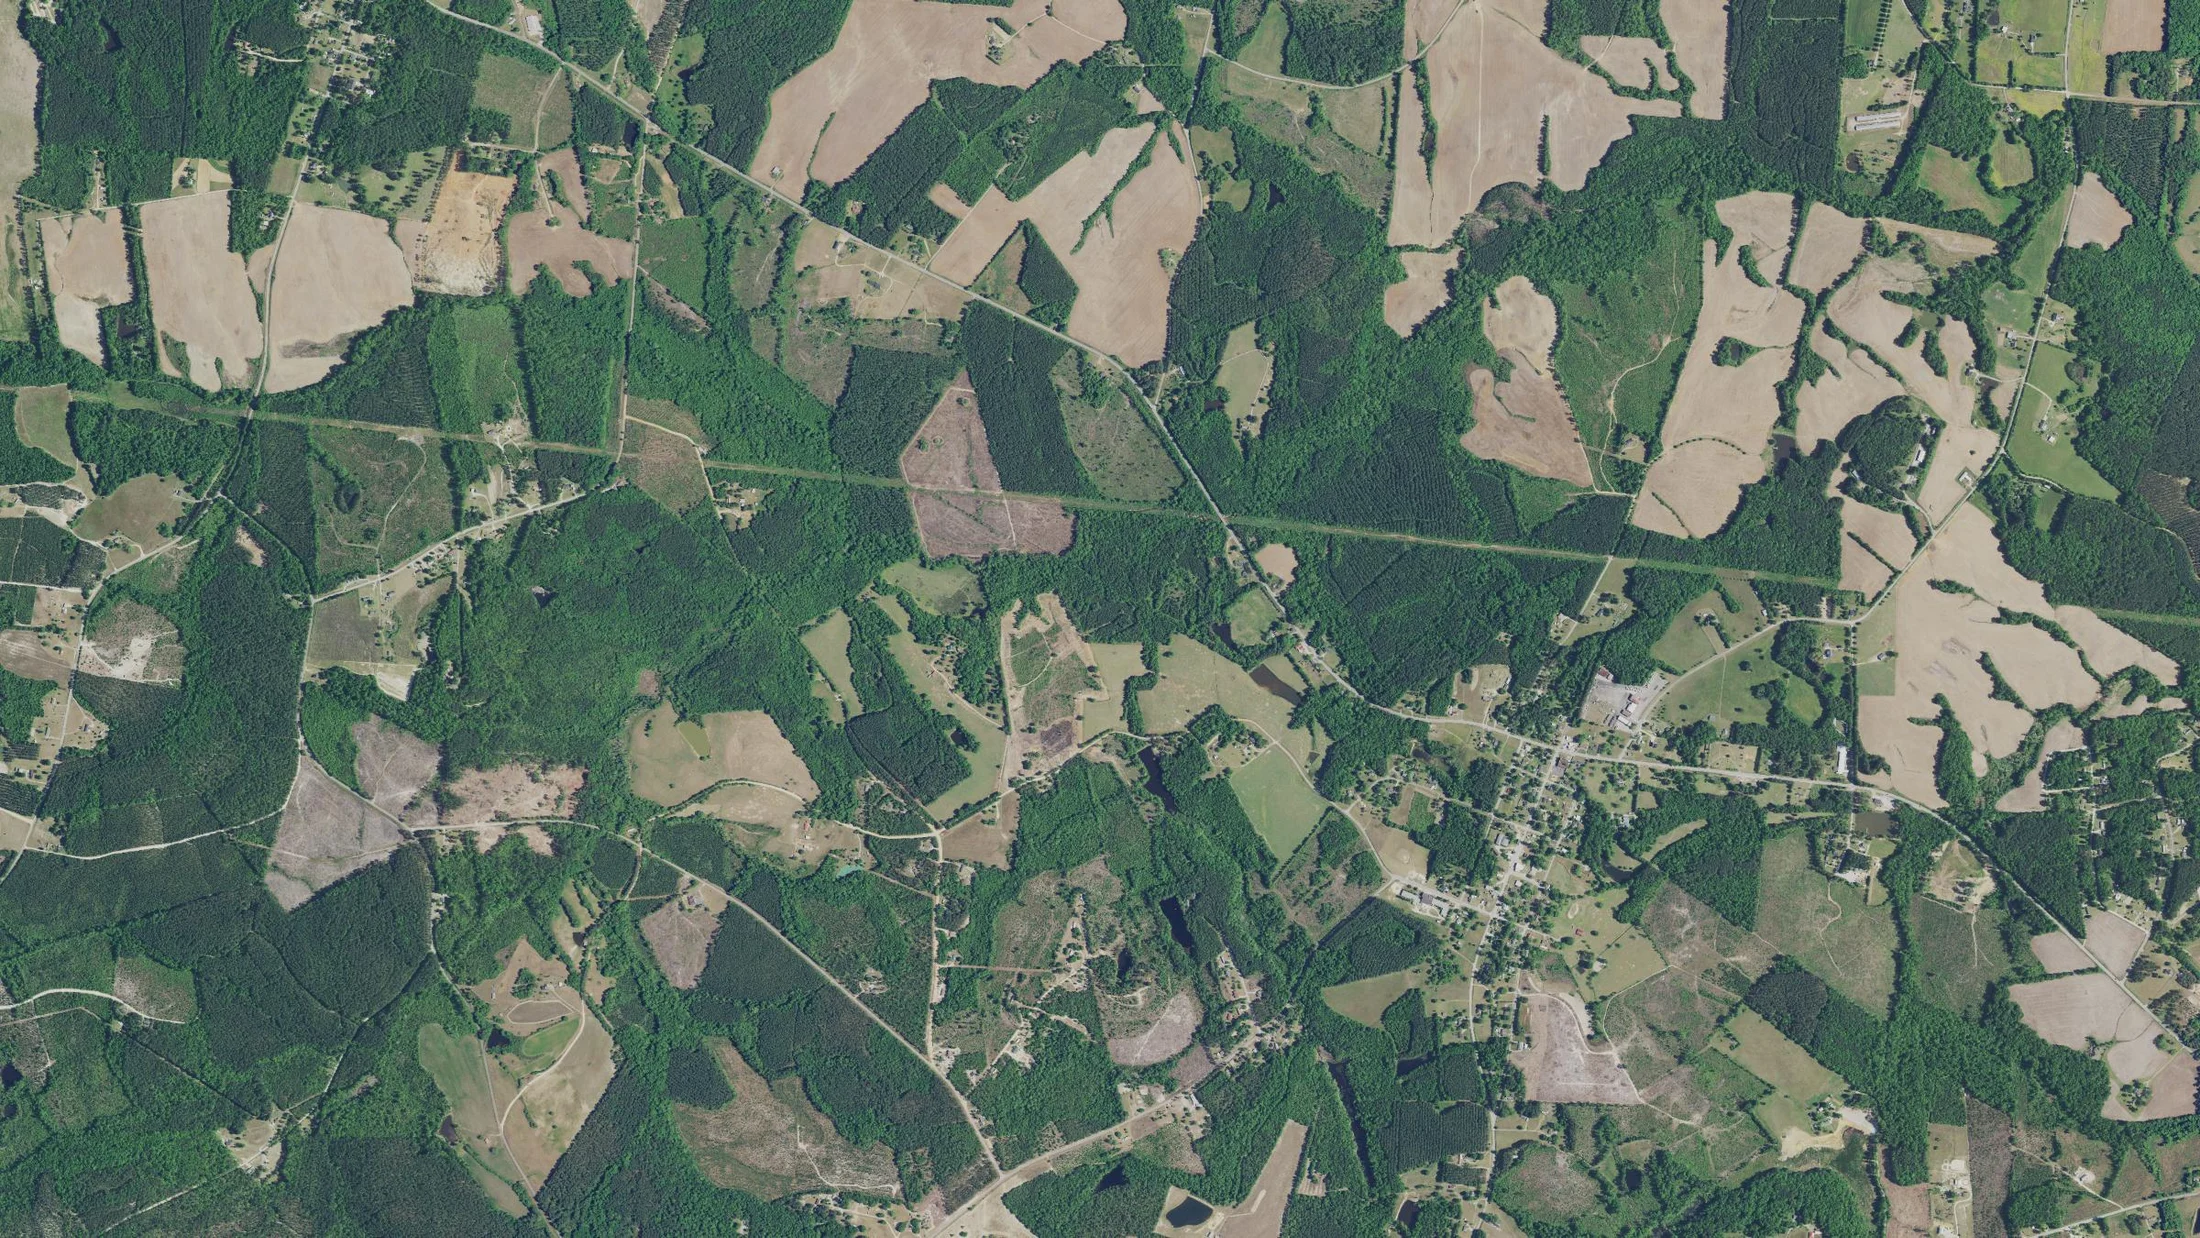
Chesterfield County aerial. USDA National Agriculture Imagery Program, 2021. Fields, forests and homes in rural Chesterfield County, centered near 34.749° N, 80.200° W. USDA NAIP source and public-domain information.
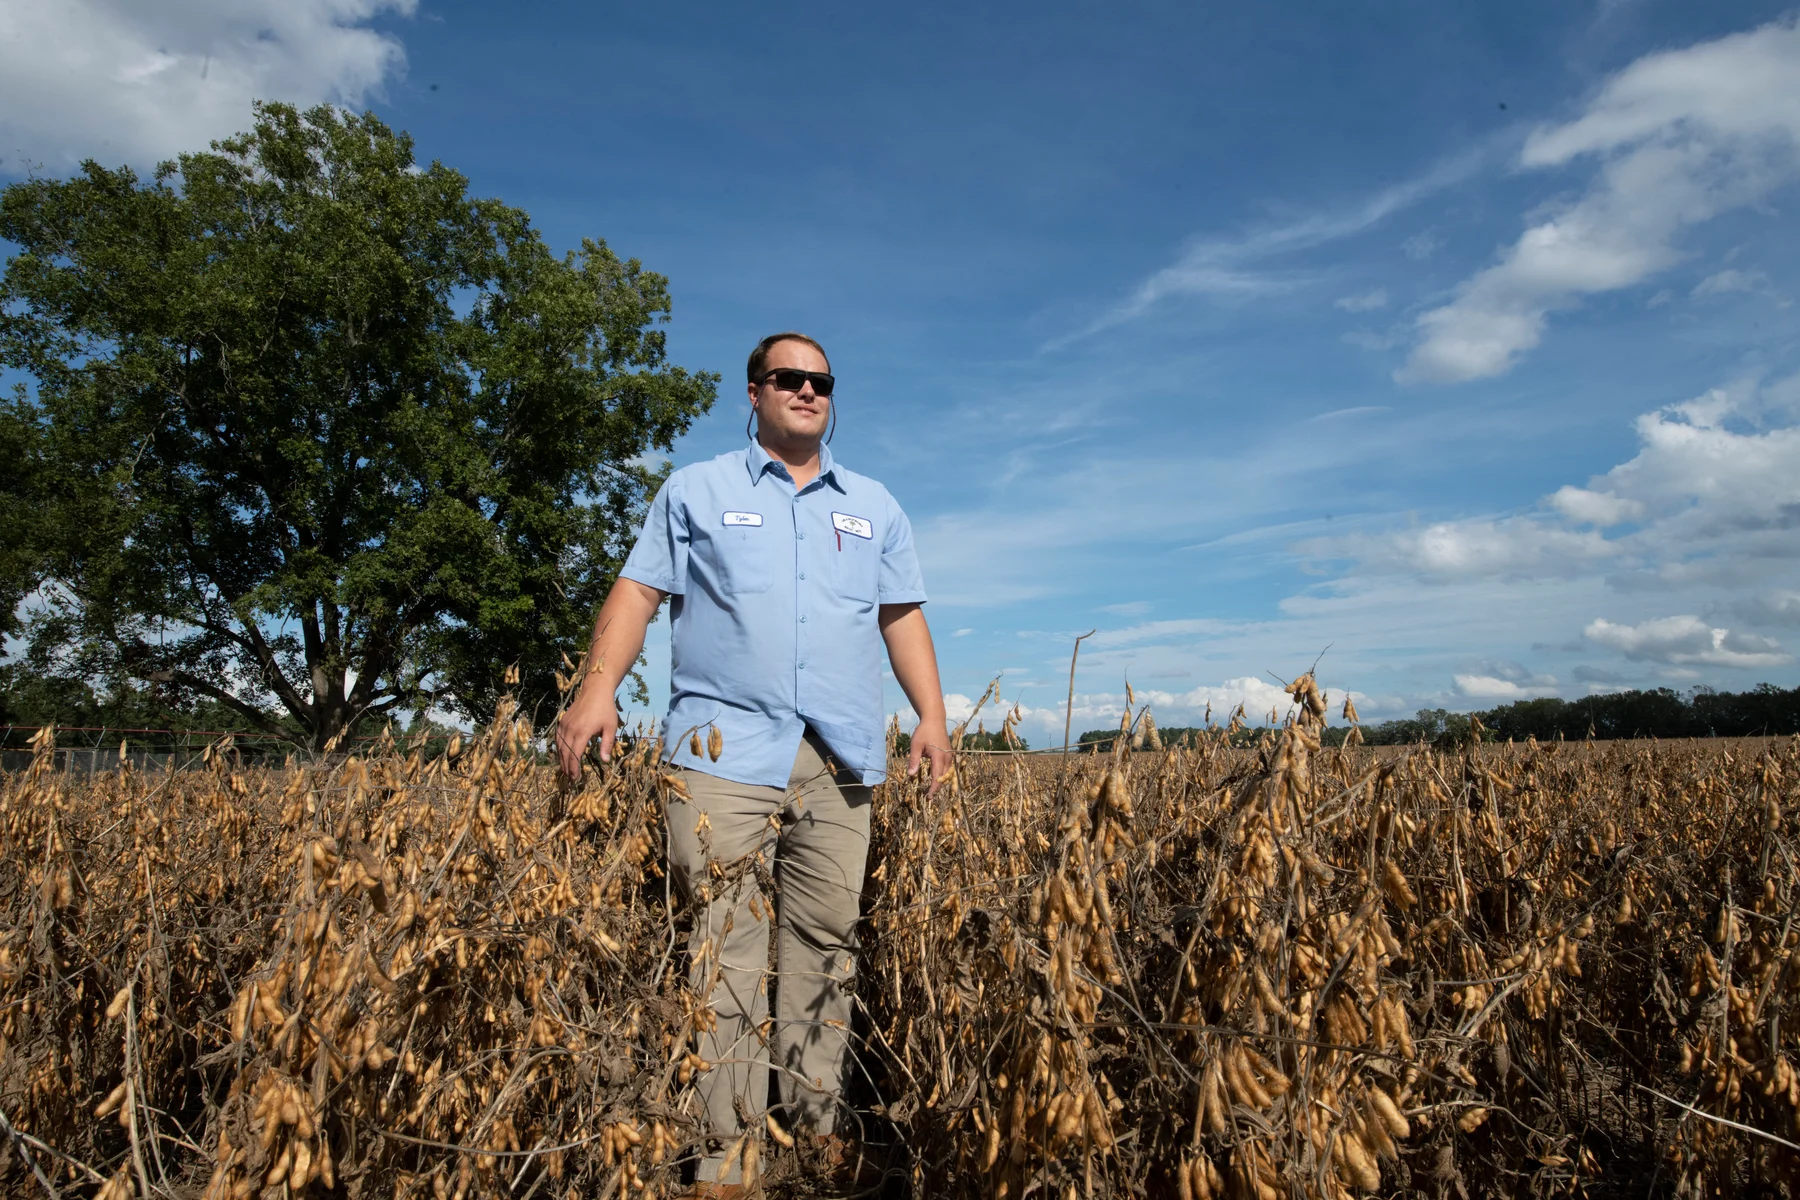
South Carolina working life. Farm operator Tyler Till checks soybeans at Till Farm in Orangeburg, South Carolina, October 22, 2019. Lance Cheung / USDA. Original photograph, public domain. This regional photograph illustrates working life; it is not a Tap patient story.
Carolina Sandhills. Wildlife Drive, Pool D, Carolina Sandhills National Wildlife Refuge. Jack Culpepper / USFWS, April 6, 2006. Original photograph · CC BY 2.0. Photographs resized and cropped for display; landscape uses a contrast overlay.
YOUR COMMUNITY’S POSSIBILITIES
Start with population. Explore what more access to care could mean for emergency readiness, school days and working families.
An adjustable annual planning scenario.
2,500 baseline deployments × 75% participation × 20% reduction
At $1,200 in assumed avoidable operating cost per deployment. This is potential resource value; actual budget savings depend on which costs can be avoided.
An ambulance ready for the person who needs it most.That part is priceless.
$36,707illustrative attendance-linked funding
0.25 day per participating student, per year. Texas funding illustration; district rules determine the actual effect.
$234,375possible wages preserved
50% of recovered workdays assumed otherwise unpaid, at $200 per day. Resident income, separate from city revenue.
These are adjustable possibilities, not measured outcomes or guaranteed savings. School and work recovery rates are planning inputs. Chesterfield’s reported results above stay separate.
All local counts cover the same service area, before participation. The default 25% household decline rate is used as a population proxy. With 75% participation and a 20% reduction among participants, the modeled change is 15% of all baseline deployments.
People and care episodes can overlap. EMS operating value, school funding and wages belong to different groups, so they are shown separately. This is not a net fiscal return or a forecast of local spending.
The assumed 20% reduction here is distinct from the reported Ferris change in non-emergent runs. Your agency’s definitions, actual demand and cost structure determine the right local inputs.
Bring your local numbers. Build a plan your team can evaluate.
Talk through your community’s possibilities
THE NEXT COMMUNITY HAS ITS OWN STORY
Bring your community’s questions, EMS and school priorities, and billing team. We’ll work through the care model, local responsibilities and the outcomes worth measuring.
Start your community’s conversation Explore the full community programCarolina Sandhills National Wildlife Refuge · Jack Culpepper / USFWS